
Reports and profit
Your real profit, sales, how fast orders move, how each courier performs, and your best customers.
Reports has six tabs: Profit & loss, Sales, Workflow, Couriers, Customers and Saved reports. On the first five you choose the time first.
Choose the dates#
- Quick buttons: Today, 7 days, 30 days, This month, Last month.
- Or set From and To and press Apply.
- Some tabs have download buttons (Orders CSV, Expenses CSV) that save the figures as a spreadsheet.
Profit and loss#
This is the tab that tells you what you really earned.
- Net profit (large) with the profit per order and the margin. A negative number is a loss.
- Stock bought: what you spent on purchases. Buying stock is not an expense until it is sold, so it is shown beside the profit, not inside it.
- Four cards: Revenue, Gross profit, Courier costs, Expenses.
- A chart of revenue, gross profit and net profit per day (per week or month for longer periods).
- How the profit is made up: a line-by-line account.
| Line | Meaning |
|---|---|
| Products sold (after discounts) | Orders delivered in the period. |
| Delivery fees charged to customers | Added to the profit. |
| Refunds paid to customers | Subtracted. |
| Cost of the goods delivered | What those products cost you. |
| Gross profit | Products sold, minus refunds, minus cost of goods. |
| Courier delivery charges, COD fees, return fees | What couriers charged. Fill in your costs in Couriers if a courier does not report them. |
| Expenses | Everything from Expenses. |
| Net profit | What is left. |
- Top expenses and Top products by profit show where money goes and what earns.
- If you have more than one warehouse you can choose one. Then expenses are left out (they belong to the whole business) and the headline becomes Profit after courier costs.
Sales#
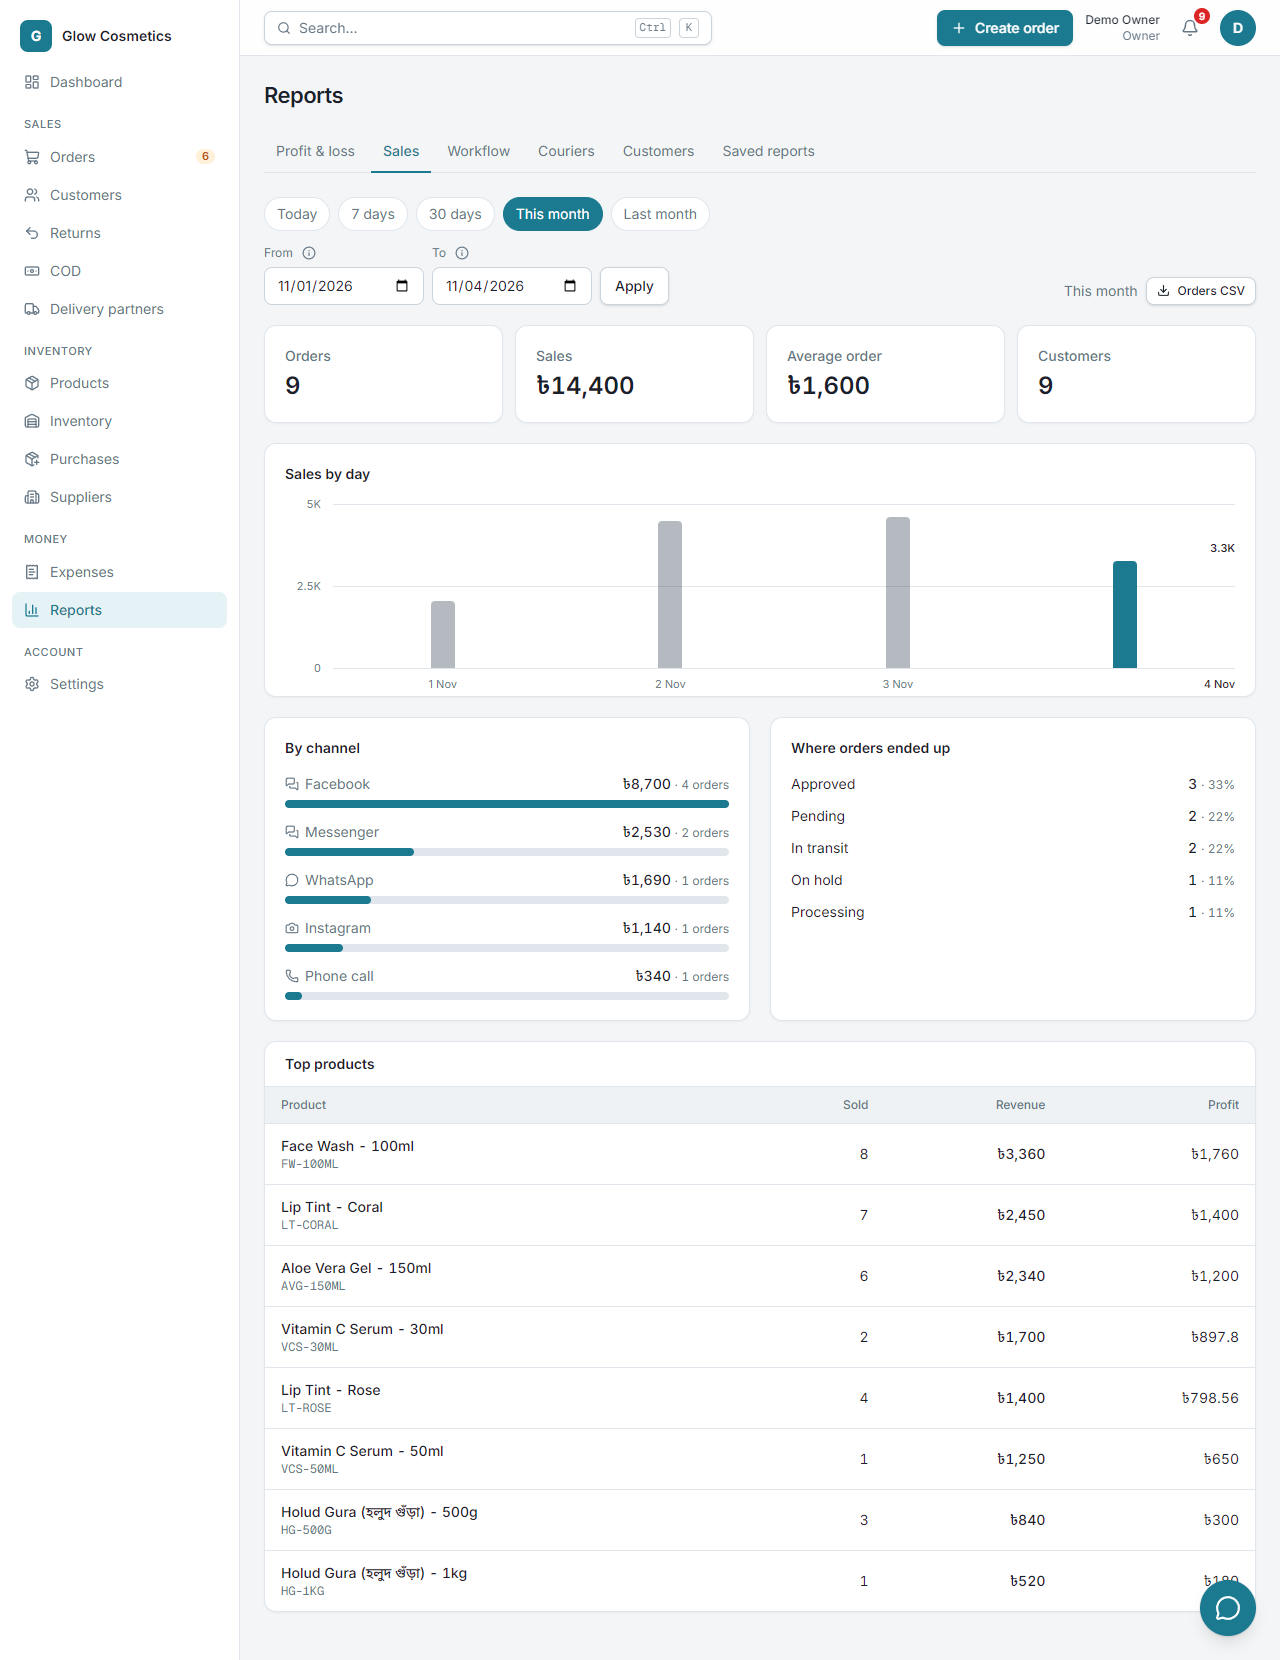
Orders, sales and the average order for the period (cancelled and returned orders are not sales: a returned parcel's goods came back; a product's revenue and profit are after its share of the order discount), Sales by day, By channel (which source earns most), Where orders ended up (delivered, returned and so on) and Top products with units, revenue and profit.
Workflow#
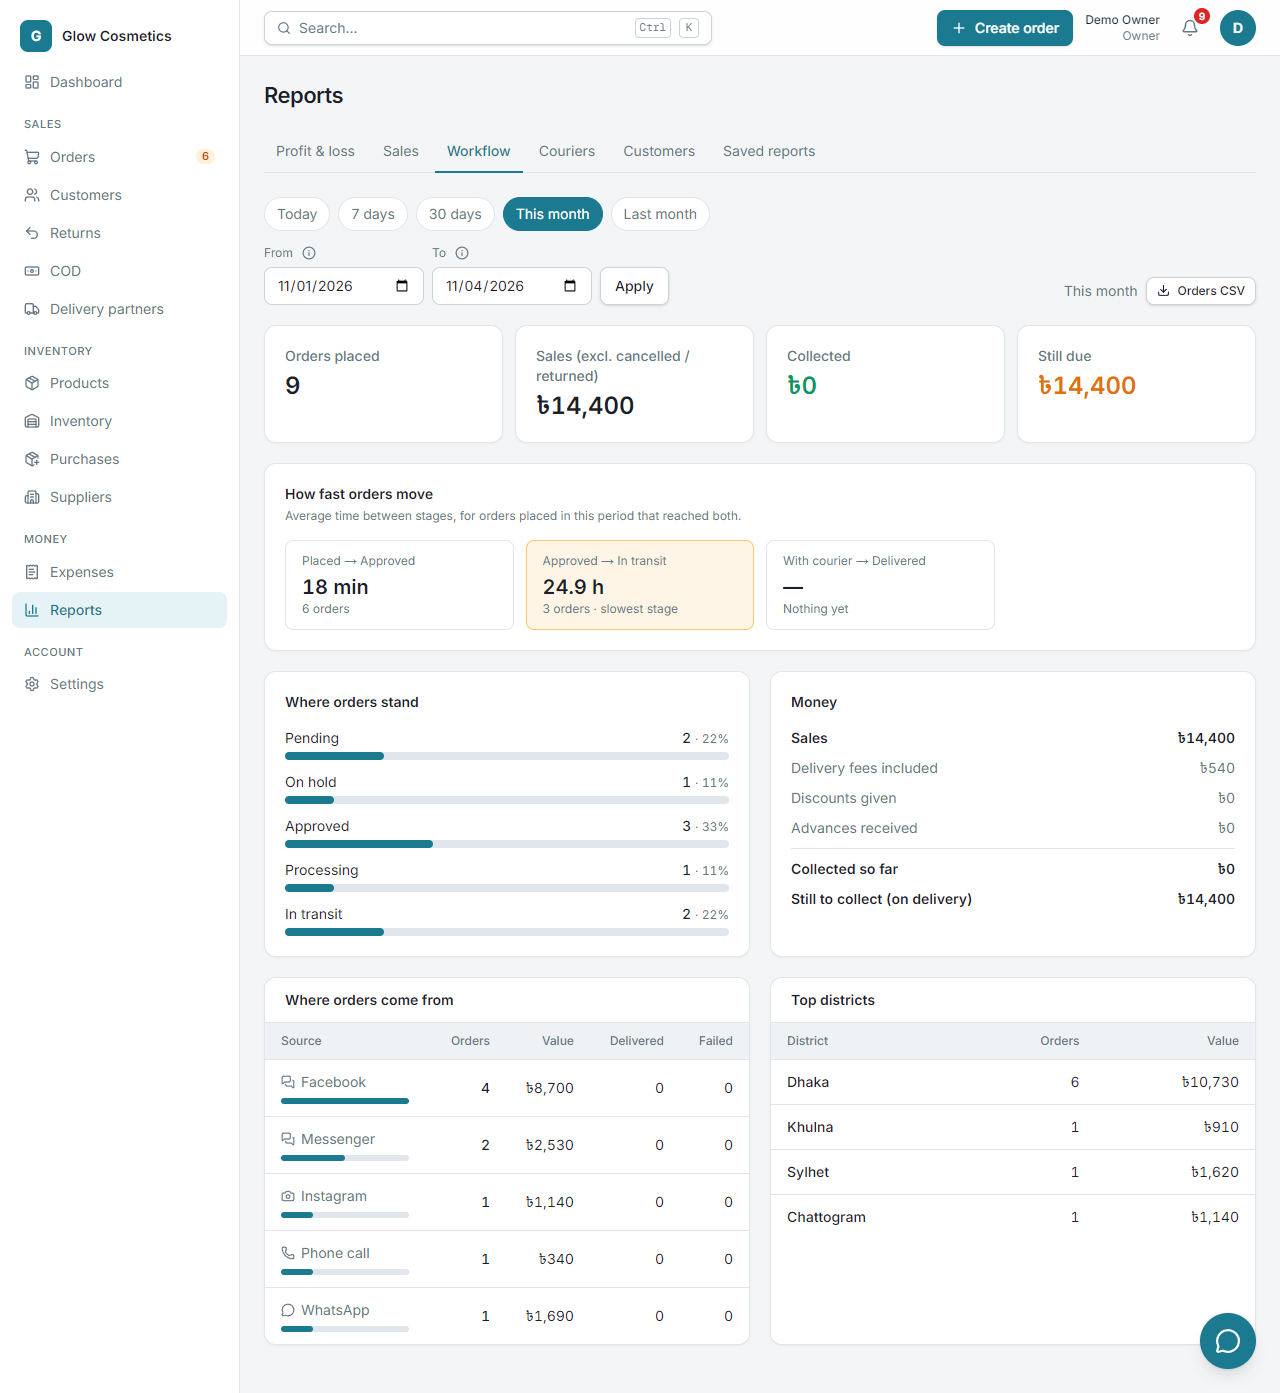
How well your process runs.
- How fast orders move: the average time from Placed → Approved, Approved → In transit and With courier → Delivered. The slowest stage is highlighted.
- Where orders stand and Money (sales, delivery fees, discounts, advances, collected so far, still to collect).
- Where orders come from with delivered and failed counts per source, and Top districts.
Couriers#
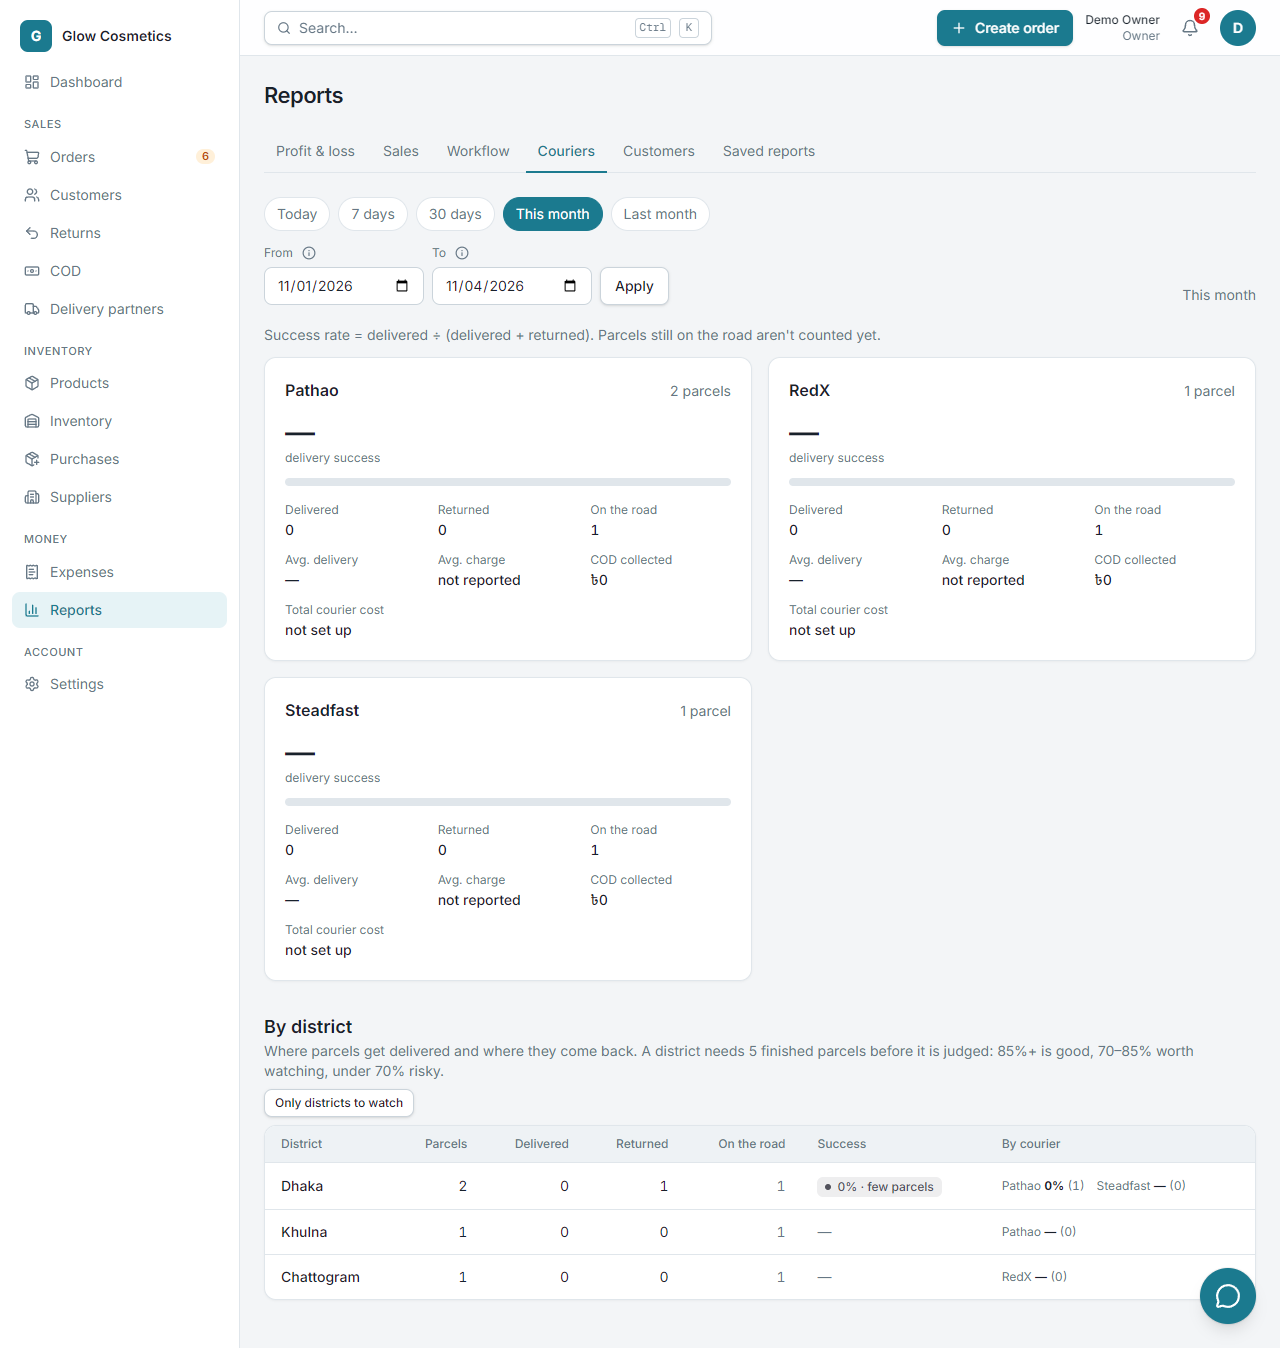
One card per courier: parcels, delivery success (delivered ÷ (delivered + returned); parcels still on the road are not counted), delivered, returned, on the road, average delivery time, COD collected and total courier cost.
By district shows where parcels are delivered and where they come back. A district needs 5 finished parcels before it is judged: 85% and above is good, 70–85% is watch, under 70% is risky. Risky districts come first. Each row also shows how each courier did there, so you can choose the best one. Only districts to watch hides the rest.
The same record warns you on the order form and in the booking dialog.
Customers#
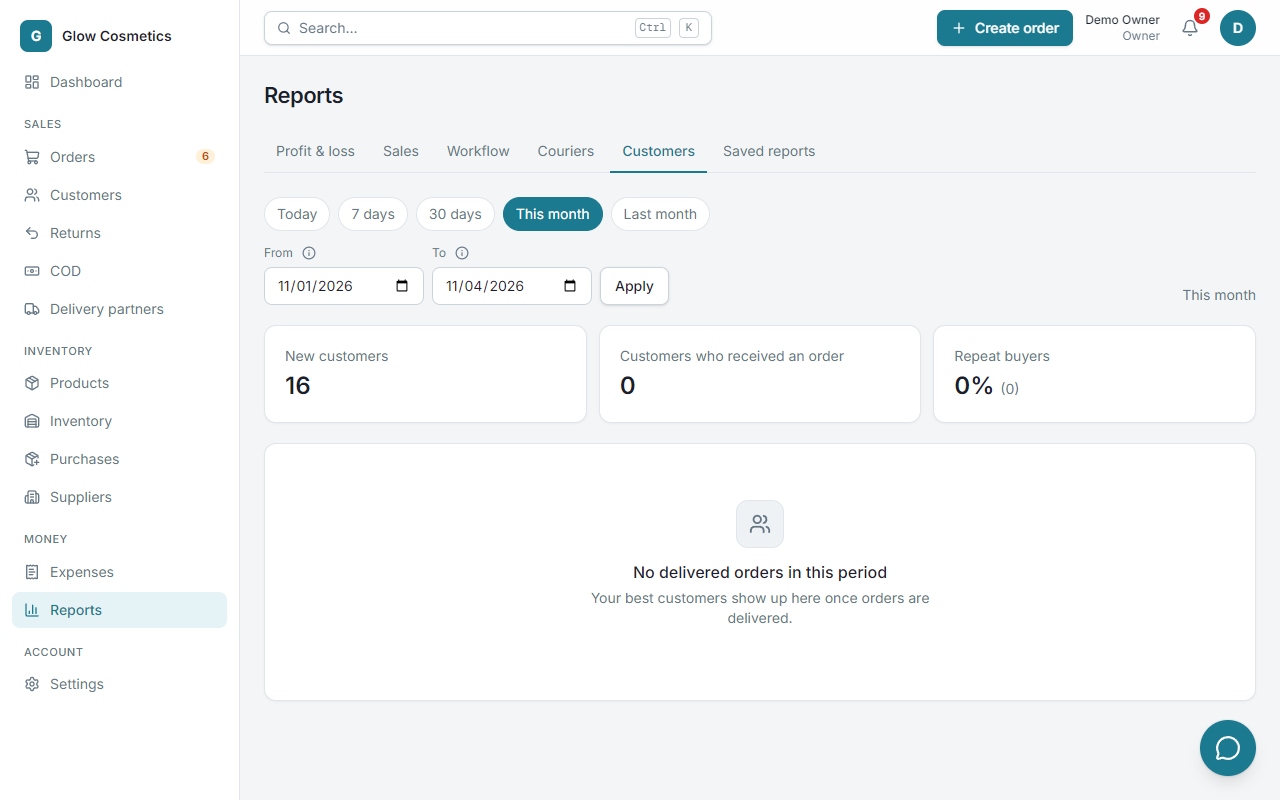
New customers, customers who received an order, repeat buyers, and your top customers by delivered orders.
Open balances#
Reports → Open balances lists every delivered order the customer has not fully paid for, oldest first: the order, the customer (with a tap-to-call phone number), when it was delivered and how many days ago, the total, what has been paid and what is still owed.
- The cards at the top show the total owed, how many orders and customers, and how old it is: 0–7, 8–30, 31–60 and over 60 days. Press one to see only those, or search by name, phone or order code.
- Press Collect on a row to record a payment (all of it or part). The row disappears when the order is paid in full.
- The same total appears as a notice at the top of the Dashboard for owners, admins and accountants, a customer's page shows Owes you, and the order list shows Owes under an order.
- Orders still on the road, cancelled and returned orders are never counted. A delivered order paid in full (including the cash a courier collected) is not here.
Saved reports#
A saved report is made once and kept, so last month's figures can be downloaded again exactly as they were on the day you saved them, even after later orders and changes.
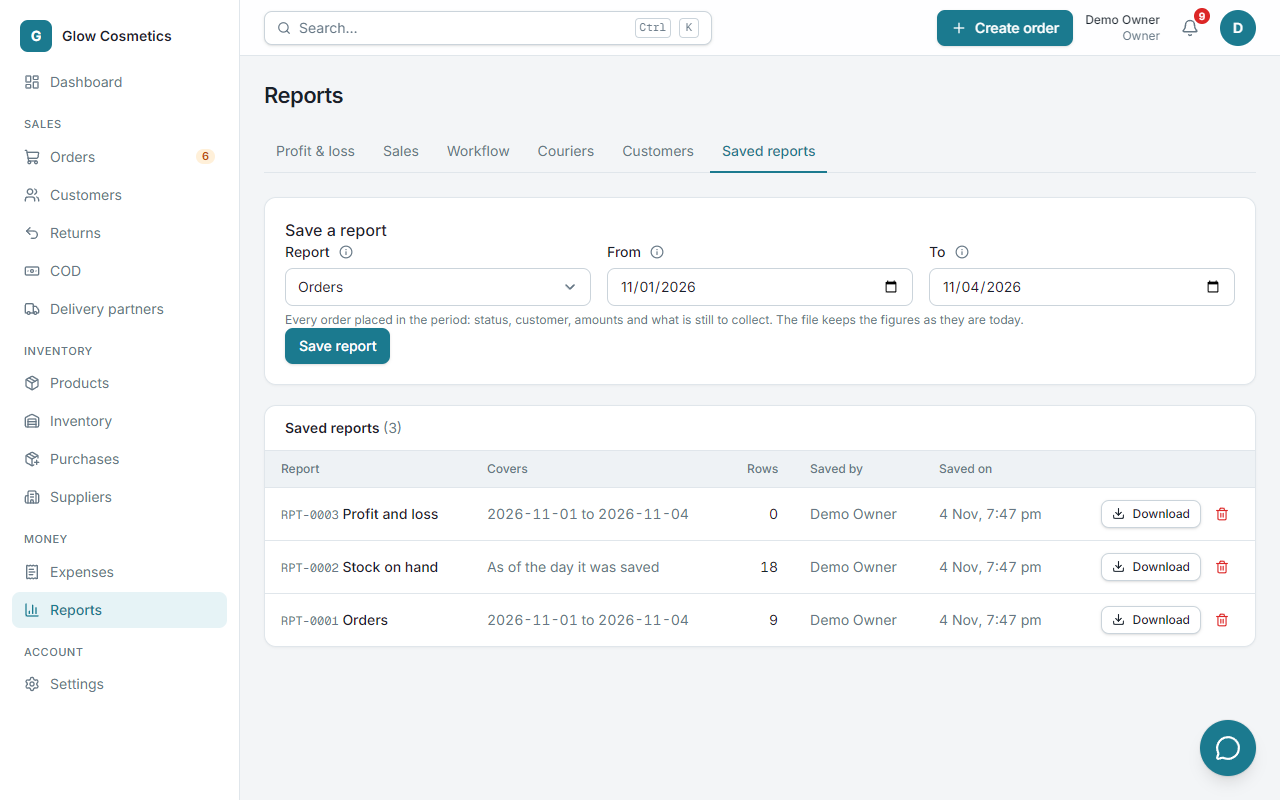
- Open Reports → Saved reports.
- Choose the Report: Orders or Expenses (for a period), Customers or Stock on hand (a picture of today), or Profit and loss (for a period; needs the See cost prices and profit permission).
- For a period, set From and To (up to a year, not in the future) and press Save report.
The list shows each report's number, what it covers, the number of rows, who saved it and when. Download gives you the CSV file; the bin deletes it (after you confirm). A business can keep 100. Owners, admins and accountants can save, download and delete reports, and every save is written in the activity log.